
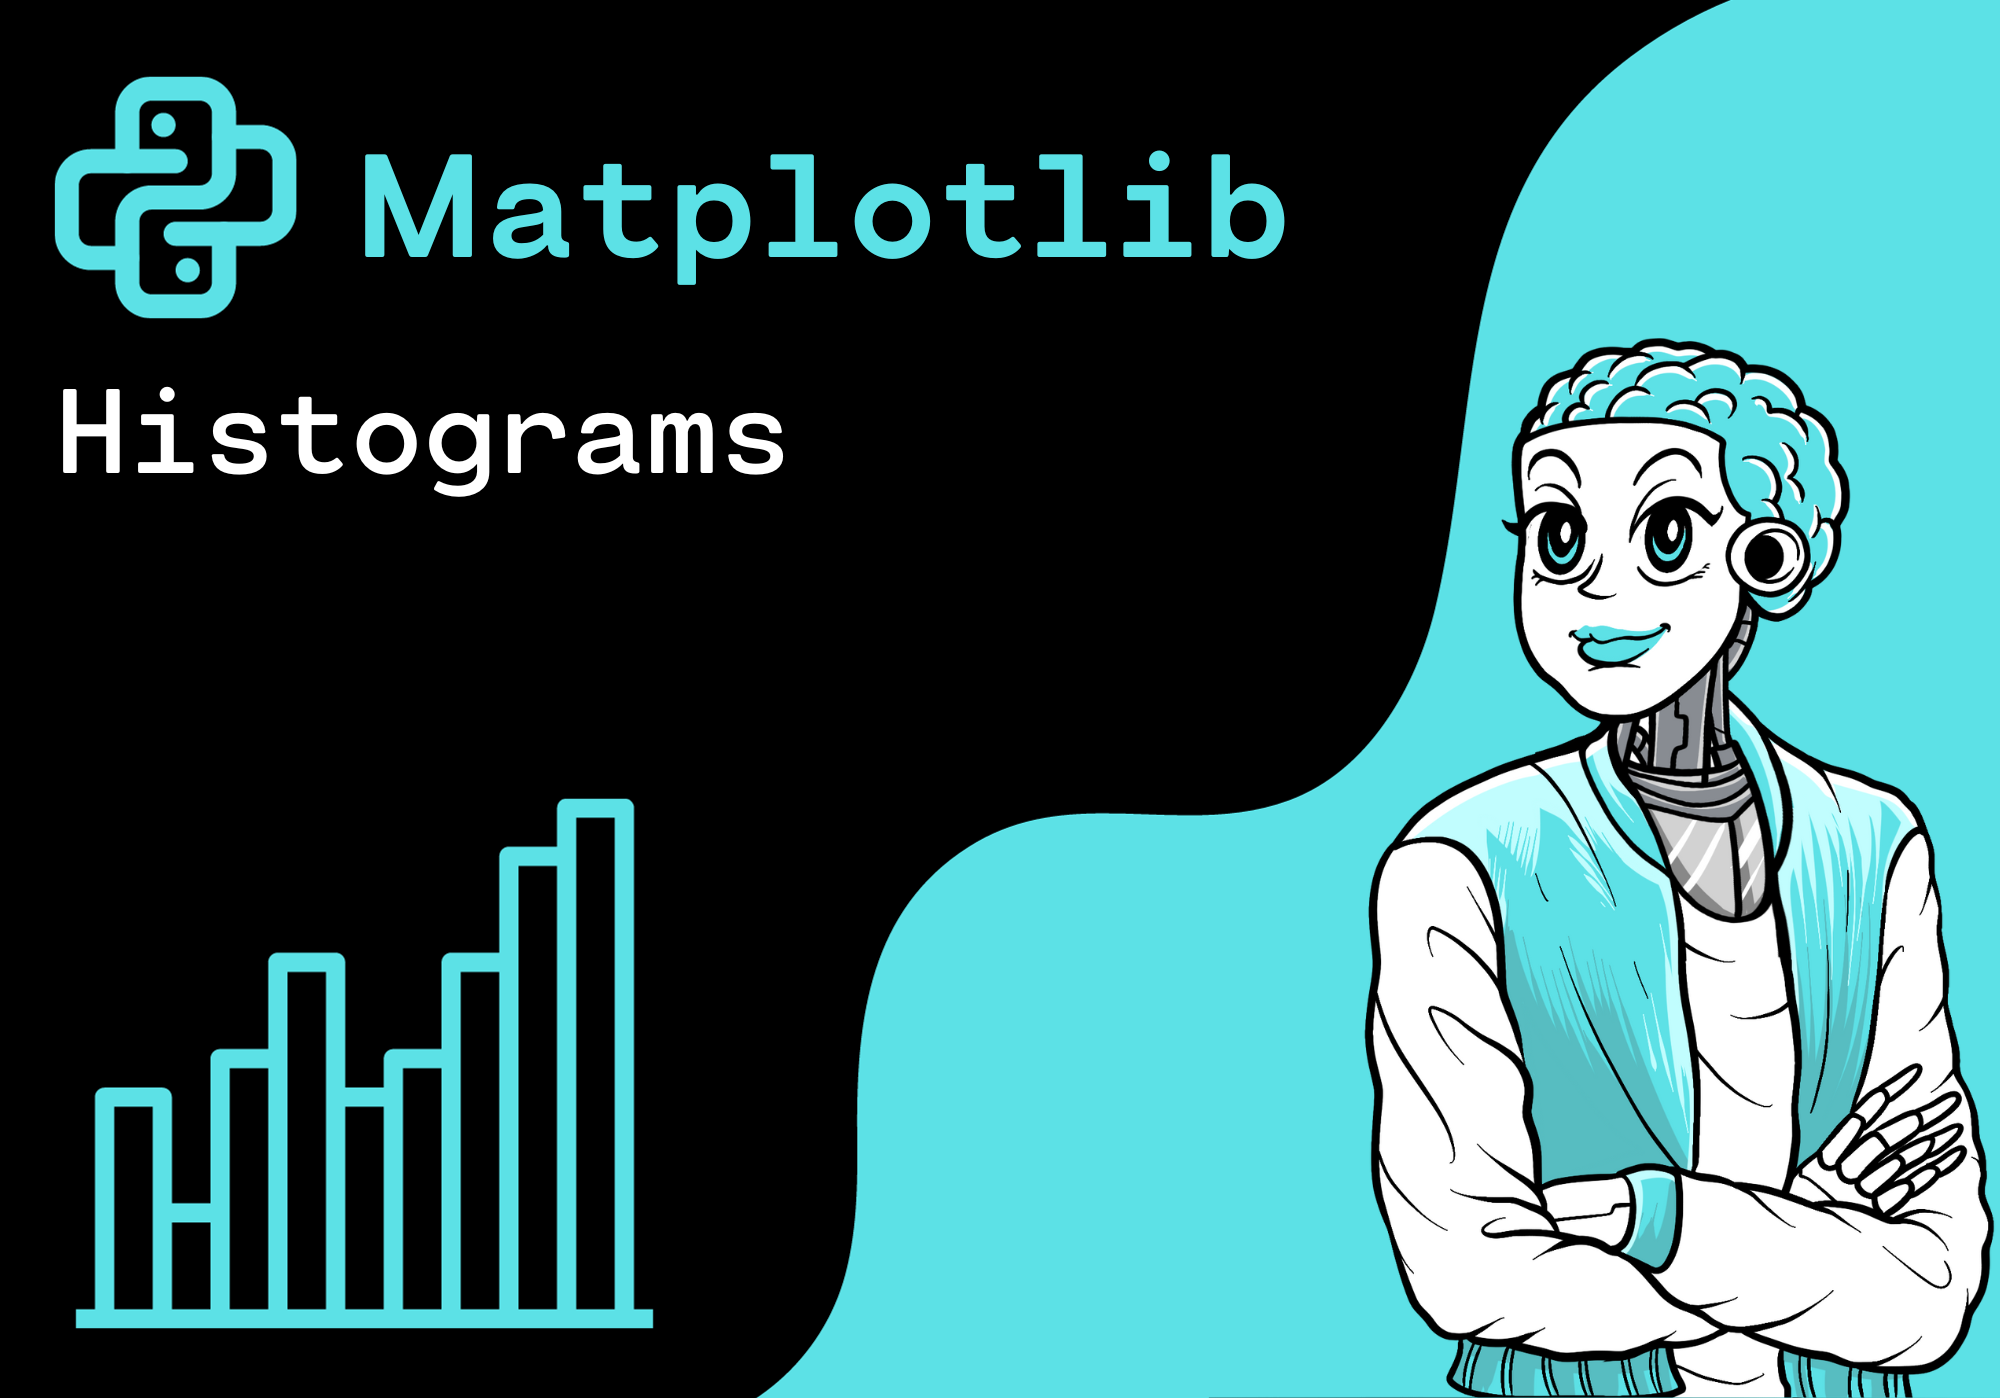


Introduction
In this tutorial, we want to create a Histogram. In order to do this, we use the hist() function of Matplotlib.
Import Libraries
First, we import the Pyplot submodule. The Pyplot submodule contains a collection of important functions such as the plot() function or the hist() function. In addition, we import NumPy.
import matplotlib.pyplot as plt
import numpy as np
Define Data
Now, let's define our example data. We consider the results of a university exam. The number of points ranges from 0 to 100. We assume that 80 students took part in the exam. We generate a random distribution with NumPy.
exam_result = np.random.randint(100, size=80)

print(exam_result)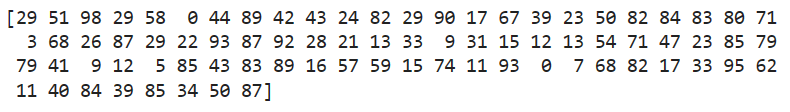
Basic Histogram
Now, we would like to draw a Histogram, that visualizes the distribution of the exam results. In order to do this, we use the hist() function.
plt.hist(exam_result)
plt.show() 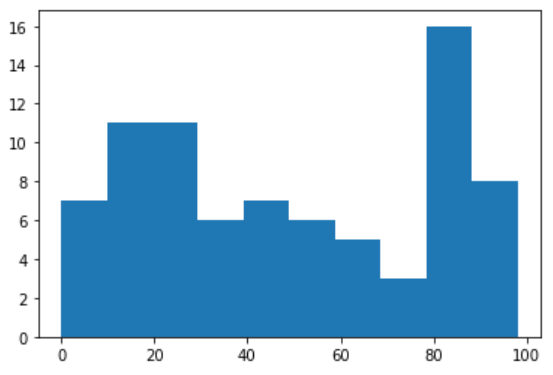
Change Style of the Histogram
Next, we want to change the style of the Histogram. We want to change the color and add a line around the bars. Furthermore we want to have five bins.
plt.hist(exam_result, bins=5, color = "lightseagreen",
         edgecolor="yellow", linewidth=0.7)
plt.show()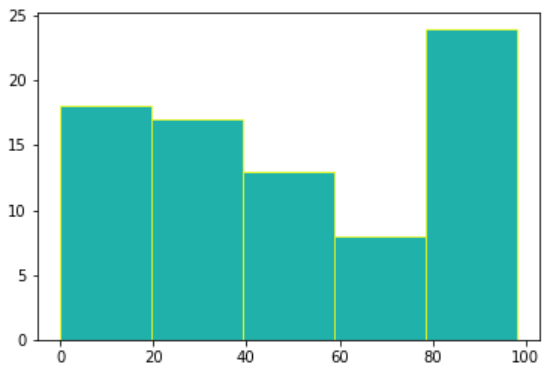
Conclusion
Congratulations! Now you are one step closer to become an AI Expert. You have seen that it is very easy to create a Histogram. We can simply use the hist() function of Matplotlib. Try it yourself!
Also check out our Instagram page. We appreciate your like or comment. Feel free to share this post with your friends.