


Introduction
In this tutorial, we want to have a look at some Colormaps provided by Matplotlib and use them in a Scatterplot.
Import Libraries
First, we import the Pyplot submodule. The Pyplot submodule contains a collection of important functions such as the plot() function or the scatter() function. In addition, we import NumPy.
import matplotlib.pyplot as plt
import numpy as np
Define Data
Now, let's define some example data points. In order to do this, we create the following NumPy Arrays:
x = np.array([1, 2, 3, 4, 5, 6, 7, 8, 9, 10])
y = np.array([4, 17, 10, 16, 18, 2, 7, 19, 15, 8])
Colormaps
Colormaps define a specific color range. The following colorbar visualizes an example of a Colormap. This Colormap ranges from 1 to 10.
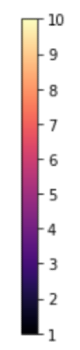
Matplotlib offers a wide selection of Colormaps. These Colormaps differ in the colors and in the transition between the colors.
Use Colormap in Scatter Plot
Now, let's try different Colormaps. In order to do this, we create a Scatterplot and set the c and the cmap parameter.
The c parameter is the color range. The color range must be defined.
The cmap parameter is the Colormap. Here we can choose the name of a Colormap provided by Matplotlib. By changing value of the cmap parameter we can use different Colormaps.
Set Color Range
First, we need to set the color range of our Colormap. In our case, we choose a range from 1 to 10.
colors = np.arange(1, 11, 1)
Colormap: Magma
Let's create a Scatterplot with the colormap "magma".
colors = np.arange(1, 11, 1)

plt.scatter(x, y, c=colors, cmap='magma')
plt.colorbar()
plt.show()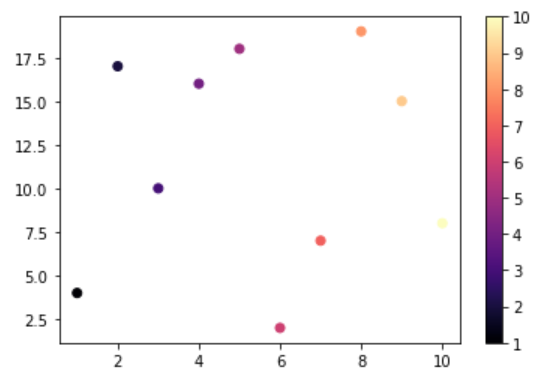
Colormap: Viridis
Let's create a Scatterplot with the colormap "viridis".
plt.scatter(x, y, c=colors, cmap='viridis')
plt.colorbar()
plt.show()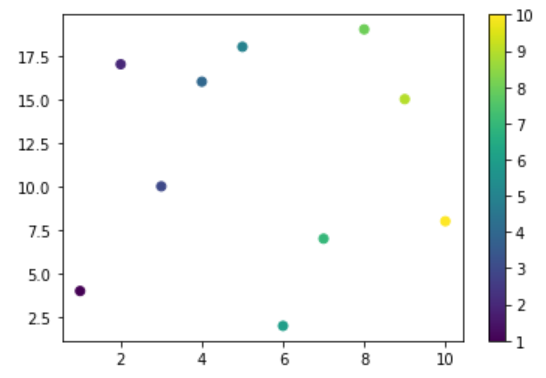
Colormap: Plasma
Let's create a Scatterplot with the colormap "plasma".
plt.scatter(x, y, c=colors, cmap='plasma')
plt.colorbar()
plt.show()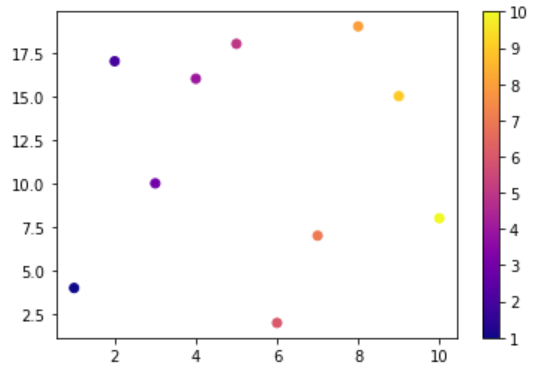
Colormap: Inferno
Let's create a Scatterplot with the colormap "inferno".
plt.scatter(x, y, c=colors, cmap='inferno')
plt.colorbar()
plt.show()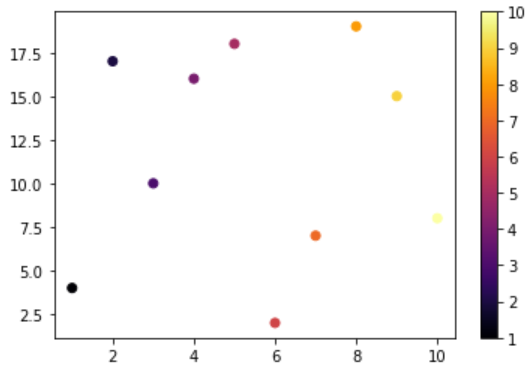
Colormap: Cividis
Let's create a Scatterplot with the colormap "cividis".
plt.scatter(x, y, c=colors, cmap='cividis')
plt.colorbar()
plt.show()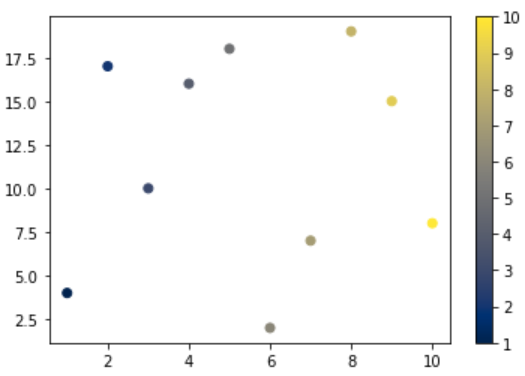
Overview of Colormaps
Finally, we an overview of the Colormaps:
#plot 1 - magma
plt.subplot(2, 3, 1)
plt.scatter(x, y, c=colors, cmap='magma')
plt.colorbar()
plt.title('magma')

#plot 2 - viridis
plt.subplot(2, 3, 2)
plt.scatter(x, y, c=colors, cmap='viridis')
plt.colorbar()
plt.title('viridis')

#plot 3 - plasma
plt.subplot(2, 3, 3)
plt.scatter(x, y, c=colors, cmap='plasma')
plt.colorbar()
plt.title('plasma')

#plot 4 - inferno
plt.subplot(2, 3, 4)
plt.scatter(x, y, c=colors, cmap='inferno')
plt.colorbar()
plt.title('inferno')

#plot 5 - cividis
plt.subplot(2, 3, 5)
plt.scatter(x, y, c=colors, cmap='cividis')
plt.colorbar()
plt.title('cividis')

plt.tight_layout()
plt.show()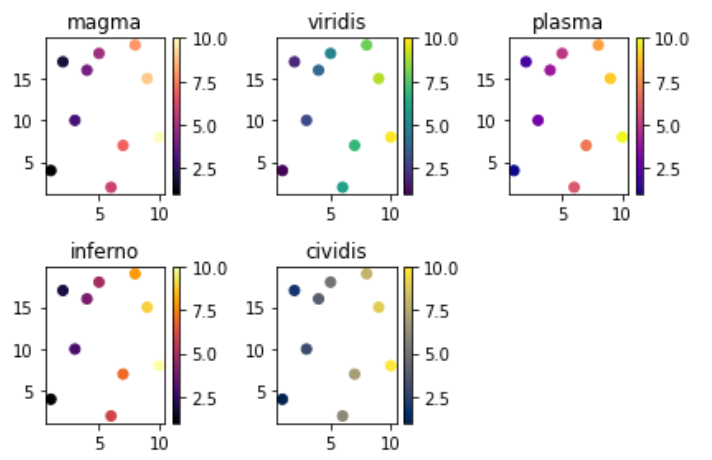
Conclusion
Congratulations! Now you are one step closer to become an AI Expert. You have seen that it is very easy to use Colormaps provided by Matplotlib. Try it yourself!
Also check out our Instagram page. We appreciate your like or comment. Feel free to share this post with your friends.