


Introduction
In this tutorial, we want to compare two datasets with a Scatterplot. In order to do this, we use the scatter() function of Matplotlib.
Import Libraries
First, we import the Pyplot submodule. The Pyplot submodule contains a collection of important functions such as the plot() function or the scatter() function. In addition, we import NumPy.
import matplotlib.pyplot as plt
import numpy as np
Define Data
Now, let's define two example datasets. In order to do this, we create the following NumPy Arrays:
x1 = np.array([1, 2, 3, 4, 7])
y1 = np.array([4, 6, 10, 12, 13])

x2 = np.array([1, 4, 5, 6, 8])
y2 = np.array([3, 7, 6, 10, 14])
Scatter Plot
Now, we want to compare these two datasets. In the following, we use the scatter() function with the default configuration. The two plots are generated with different colors.
plt.scatter(x1,y1)
plt.scatter(x2,y2)
plt.show()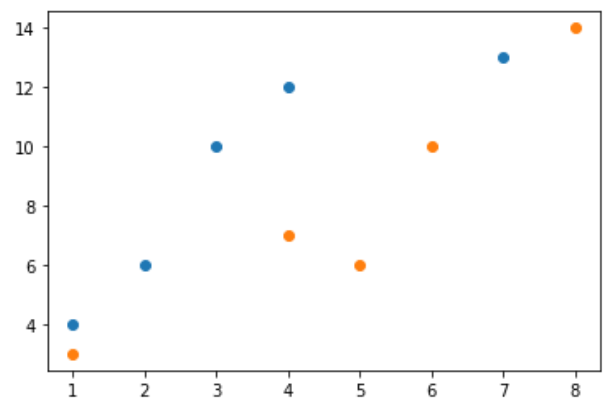
Conclusion
Congratulations! Now you are one step closer to become an AI Expert. You have seen that it is very easy to compare multiple datasets with a Scatterplot. We can simply use the scatterplot() function of Matplotlib. Try it yourself!
Also check out our Instagram page. We appreciate your like or comment. Feel free to share this post with your friends.