


Introduction
In this tutorial, we want to create a Barplot. In order to do this, we use the bar() function of Matplotlib.
Import Libraries
First, we import the Pyplot submodule. The Pyplot submodule contains a collection of important functions such as the plot() function or the bar() function. In addition, we import NumPy.
import matplotlib.pyplot as plt
import numpy as np
Define Data
Now, let's define our example data. We consider the number of users for two different programming tools over the years 2018 - 2021.
labels = ["2018", "2019", "2020", "2021"]
users_tool1 = [110, 100, 240, 310]
users_tool2 = [90, 140, 250, 160]
Single Barplot
We would like to plot the number of users of Tool 1. To do this, we use the bar() function with some further configurations.
plt.bar(labels, users_tool1, color='aquamarine')
plt.xlabel("Years")
plt.ylabel("Users")
plt.title('Users of Tool 1')
plt.show()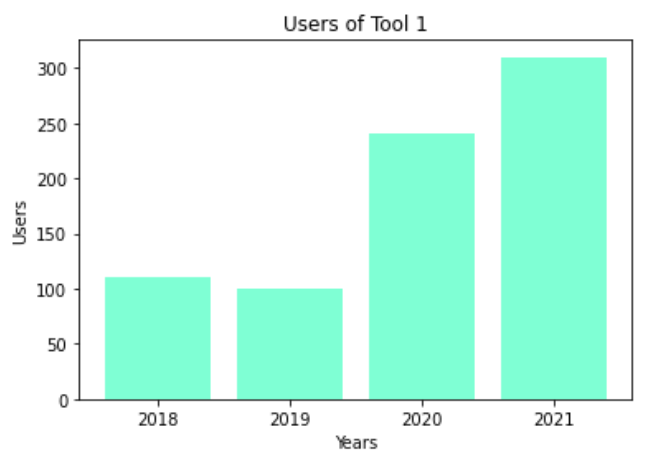
Multiple Barplots
Now, we want to compare the number of users of Tool 1 and Tool 2 with Barplots. To do this, we use the bar() function two times with some further configurations.
width = 0.40
x = np.arange(len(labels))

plt.bar(x - width/2, users_tool1, width, color='aquamarine')
plt.bar(x + width/2, users_tool2, width, color='lightseagreen')
plt.xticks(x, labels)

plt.xlabel("Years")
plt.ylabel("Users")
plt.title('Users of Tool 1 and Tool 2')
plt.legend(["Tool 1", "Tool 2"])
plt.show()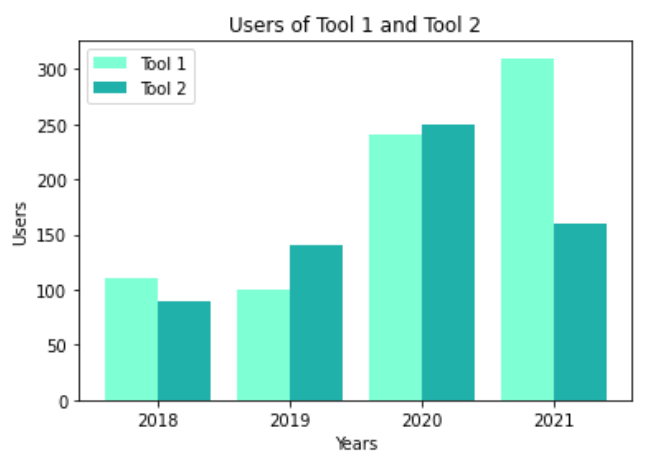
Conclusion
Congratulations! Now you are one step closer to become an AI Expert. You have seen that it is very easy to create a Barplot. We can simply use the bar() function of Matplotlib. Try it yourself!
Also check out our Instagram page. We appreciate your like or comment. Feel free to share this post with your friends.