


Introduction
In this tutorial, we want to plot points with Python. In order to do this, we use the plot() function of Matplotlib.
Import Libraries
First, we import the Pyplot submodule. The Pyplot submodule contains a collection of important functions such as the plot() function. In addition, we import NumPy.
import matplotlib.pyplot as plt
import numpy as np
Define Data
Now, let's define some example data points. In order to do this, we create the following NumPy Arrays:
x = np.array([1, 2, 3, 4, 5])
y = np.array([4, 6, 10, 12, 18])
Plot Points
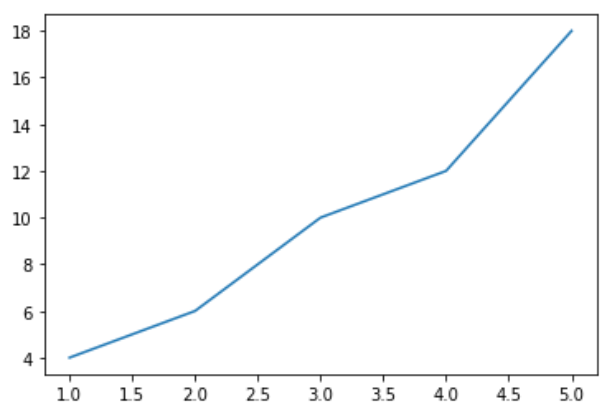
Now, we want to plot these data points. In order to do this, we use the plot() function. We use the function just by default, without any further configurations. In this case, the plot() function draws a line from point to point.
plt.plot(x,y)
Change Linestyle
Now, we define some specific configurations such as the line color, line type or the labels of the axes.
plt.plot(x, y, color="red", linestyle="--")
plt.xlabel("X values")
plt.ylabel("Y values")
plt.show()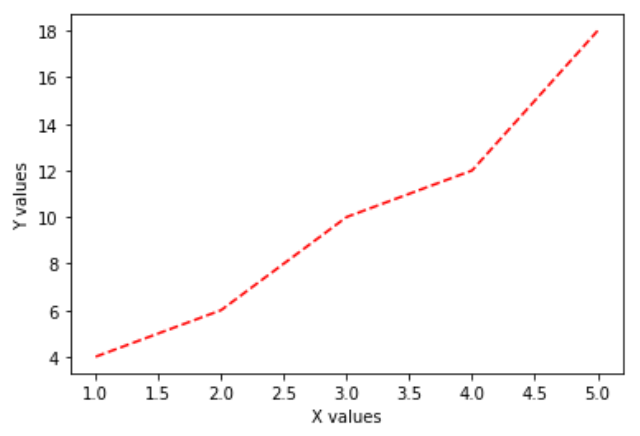
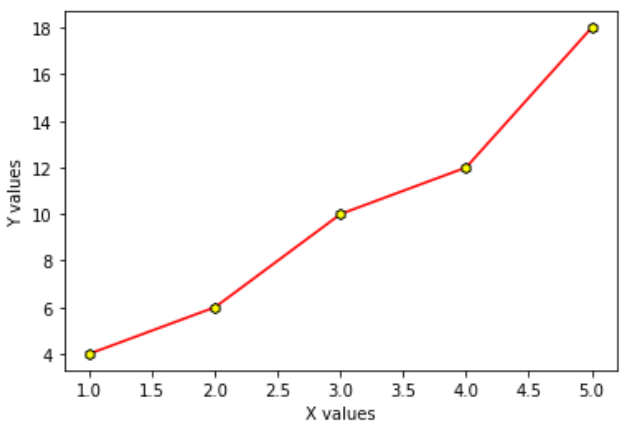
Let's test some more styling options.
plt.plot(x, y, marker="h",color="red", markerfacecolor="yellow", markeredgecolor='black')
plt.xlabel("X values")
plt.ylabel("Y values")
plt.show()
Remove Line
Now, we want to plot the points as Scatter Plot. In order to remove the line, we set "o" as marker .
plt.plot(x, y,"o")
plt.xlabel("X values")
plt.ylabel("Y values")
plt.show()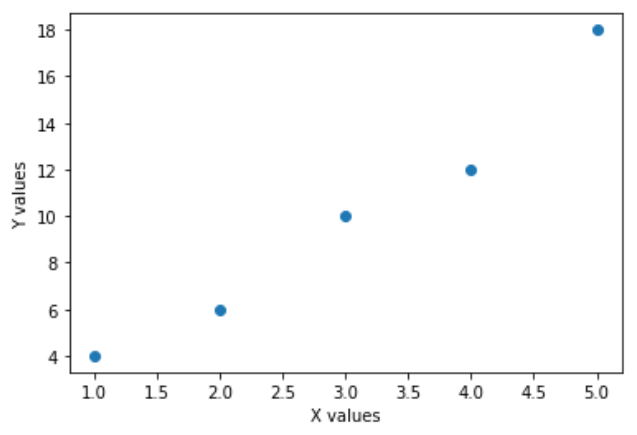
Conclusion
Congratulations! Now you are one step closer to become an AI Expert. You have seen that it is very easy to plot points with Python. We can simply use the plot() function of Matplotlib. Try it yourself!
Also check out our Instagram page. We appreciate your like or comment. Feel free to share this post with your friends.