


Introduction
In this tutorial, we want to create a Lineplot. In order to do this, we use the lineplot() function of Seaborn.
Import Libraries
First, we import the following python modules:
import seaborn as sns
import matplotlib.pyplot as plt
Load Data
We would like to use a seaborn sample dataset. Let's load the "flights" dataset into python. This dataset contains the monthly number of passengers over a period of 10 years.
flights_df = sns.load_dataset("flights")

flights_df.head()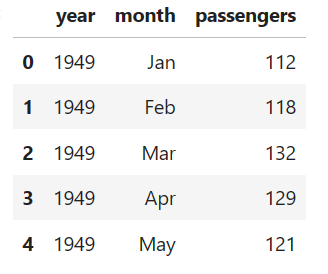
Filter Data
Let's analyze the number of passengers in December and how it has developed over the years. In order to do this, we filter the DataFrame by the month of December.
december_flights_df = flights_df.query("month == 'Dec'")

december_flights_df.head()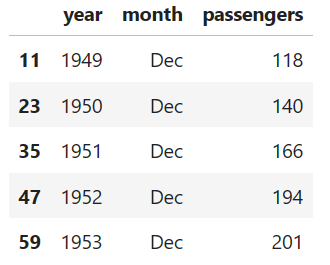
Example 1: Simple Lineplot
Next, we create a lineplot with the lineplot() function. Additionally, we choose "darkgrid" as figure style.
#figure style
sns.set_style('darkgrid')
fig, ax = plt.subplots(figsize=(12, 7))

#lineplot
sns.lineplot(x='year', y='passengers', data=december_flights_df)

plt.show()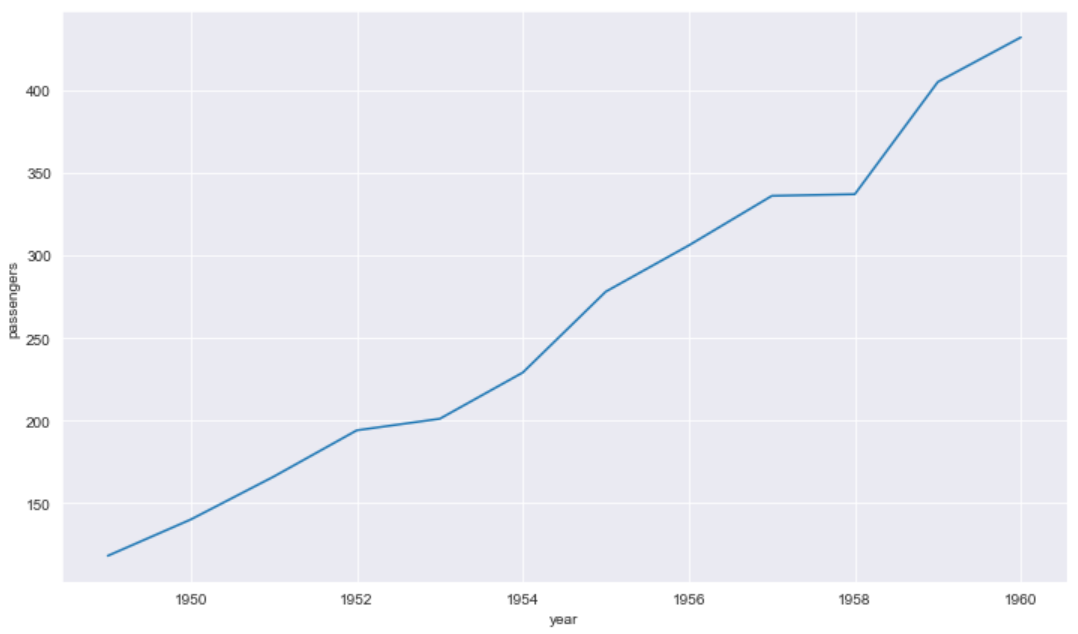
Example 2: Lineplot with Grouping
Let's analyze the development of the number of passengers for all months over the years. To do this, we consider our DataFrame without filters. The parameter "hue" specifies the grouping.
#figure style
sns.set_style('darkgrid')
fig, ax = plt.subplots(figsize=(12, 7))

#lineplot
sns.lineplot(x='year', y='passengers', hue='month', data=flights_df)

plt.show()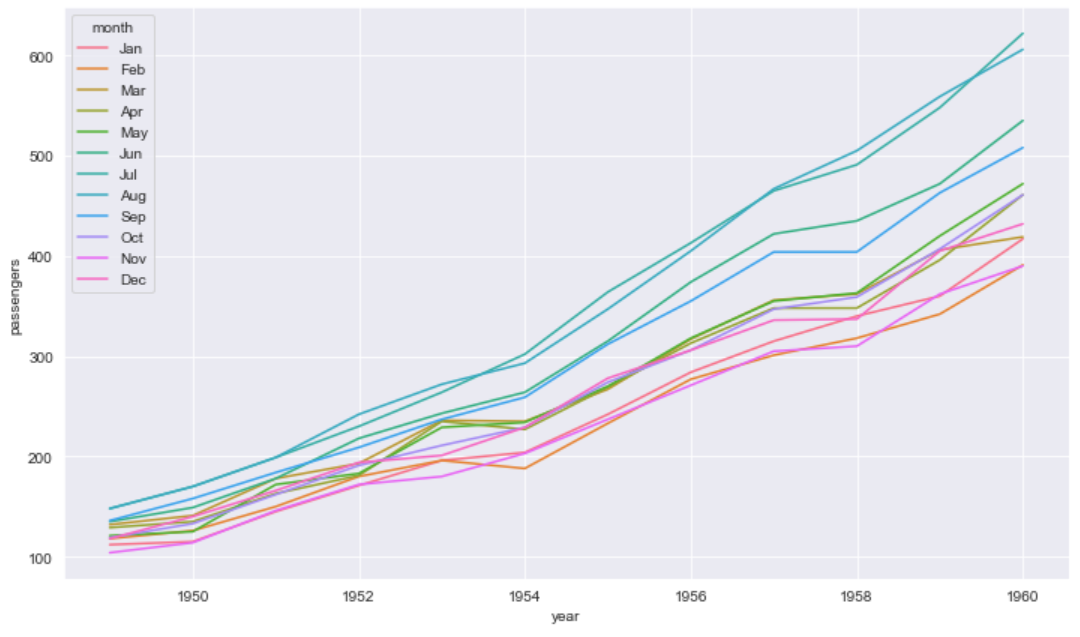
Example 3: Lineplot with Aggregation
Let's analyze the development of the number of passengers on an annual basis. Again, we use the unfiltered DataFrame. In this case, there are several values for each year. Seaborn aggregates the values for each year and the plot shows the mean and the 95% confidence interval by default.
#figure style
sns.set_style('darkgrid')
fig, ax = plt.subplots(figsize=(12, 7))

#lineplot
sns.lineplot(x='year', y='passengers', data=flights_df)

plt.show()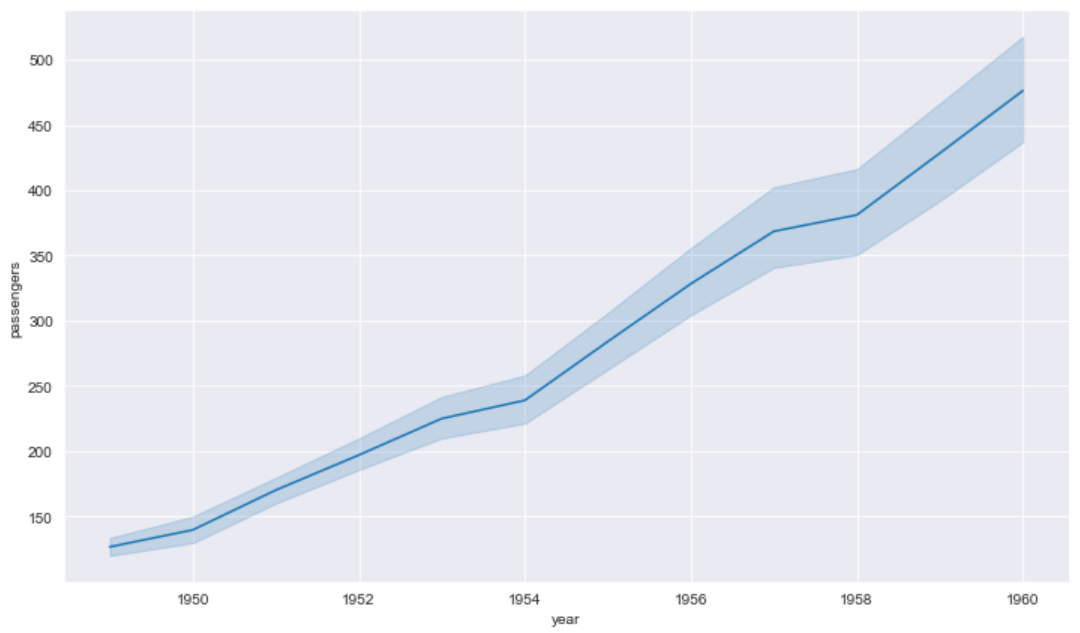
Conclusion
Congratulations! Now you are one step closer to become an AI Expert. You have seen that it is very easy to create a Lineplot. We can simply use the lineplot() function of Seaborn. Try it yourself!
Also check out our Instagram page. We appreciate your like or comment. Feel free to share this post with your friends.