


Introduction
In this tutorial, we want to create a Swarmplot. In order to do this, we use the swarmplot() function of Seaborn.
Import Libraries
First, we import the following python modules:
import seaborn as sns
import matplotlib.pyplot as plt
Load Data
We would like to use a seaborn sample dataset. Let's load the "penguins" dataset into python.
penguins_df = sns.load_dataset("penguins")

penguins_df.head()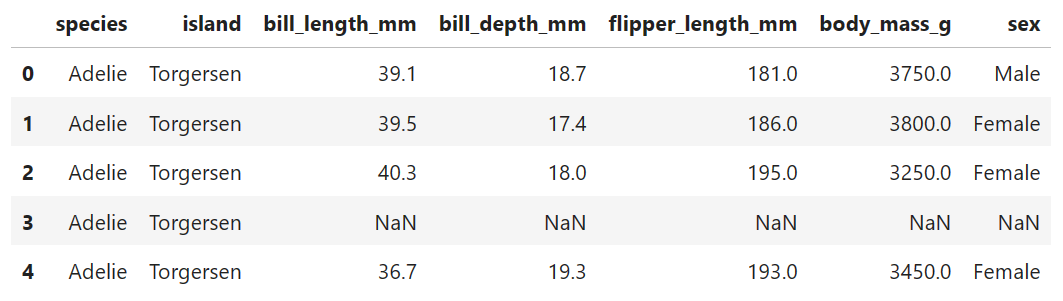
Swarplot
With Swarmplots, the distribution of a numeric variable can be visualized. The special thing about Swarmplots is, that the points are arranged in a way so that they do not overlap. This makes the plot look like a swarm.
Example 1: Plot one Variable
In our first example we want to plot the flipper length. In order to do this, we set the x parameter to "flipper_length_mm".
sns.swarmplot(data=penguins_df, x="flipper_length_mm")

plt.show()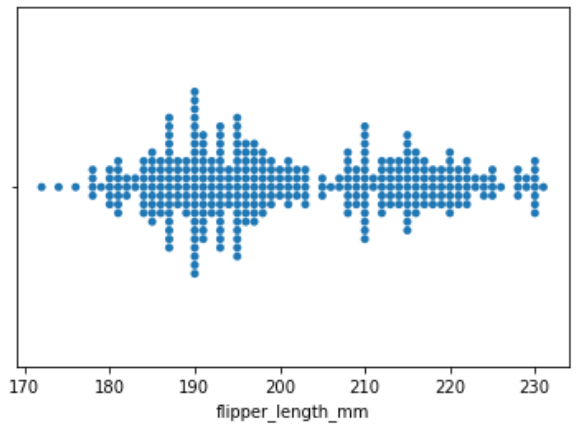
Example 2: Plot two Variables
Now, we want to plot the distribution of the flipper length for each species. In addition to the x parameter, we use the y parameter and set it to "species".
sns.swarmplot(data=penguins_df, x="flipper_length_mm", y="species")

plt.show()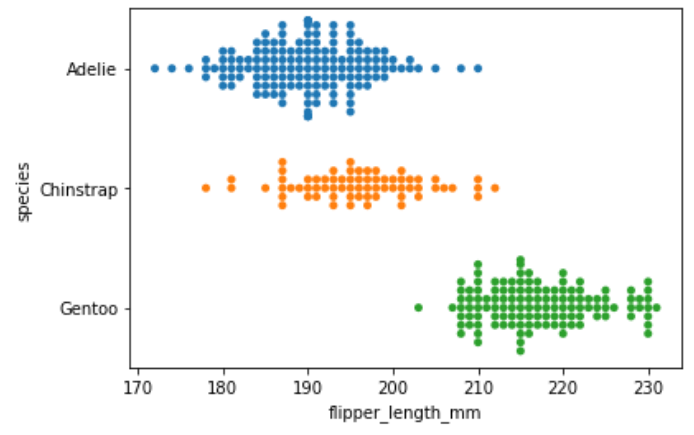
Example 3: Decrease Size of Markers
Now, we want to decrease the size of the markers. In order to do this, we use the size parameter and set it to 3.
sns.swarmplot(data=penguins_df, x="flipper_length_mm", y="species",
              size=3)

plt.show()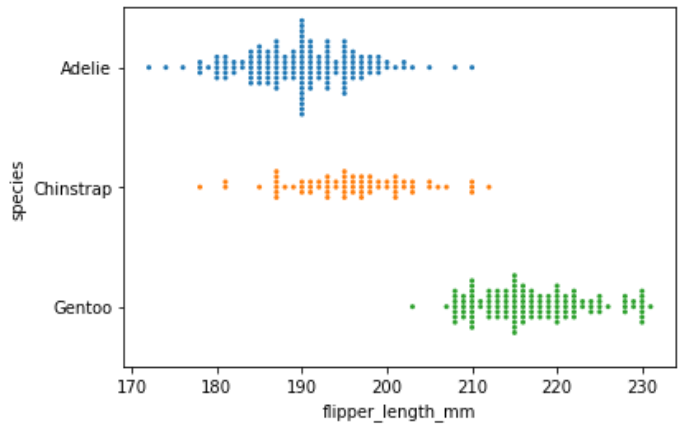
Example 4: Swarmplot with Grouping
Now, we want to highlight the sex of the penguins. In order to do this, we use the hue parameter and set it to "sex".
sns.swarmplot(data=penguins_df, x="flipper_length_mm", y="species",
              size=3, hue ="sex")

plt.show()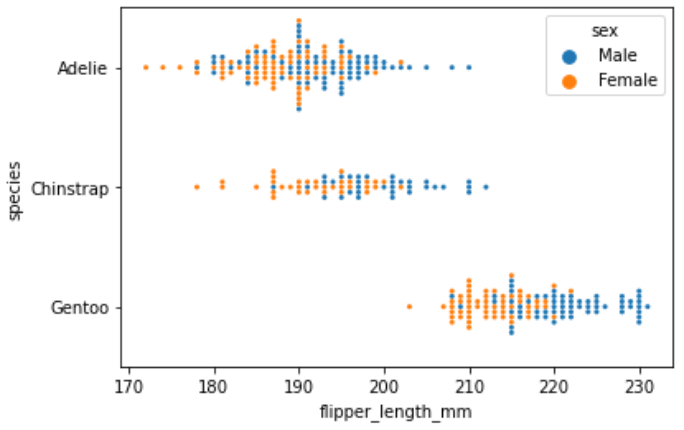
Example 5: Split Swarms
Now, we want to split the distribution for each category into separate swarms. In order to do this, we use the dodge parameter and set it to True.
sns.swarmplot(data=penguins_df, x="flipper_length_mm", y="species",
              size=3, hue="sex", dodge=True)

plt.show()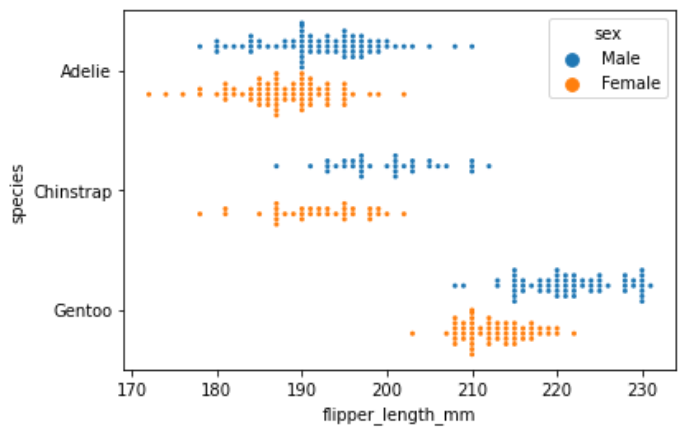
Conclusion
Congratulations! Now you are one step closer to become an AI Expert. You have seen that it is very easy to create a Swarmplot. We can simply use the swarmplot() function of Seaborn. Try it yourself!
Also check out our Instagram page. We appreciate your like or comment. Feel free to share this post with your friends.