


Introduction
In this tutorial, we want to create a Stripplot. In order to do this, we use the stripplot() function of Seaborn.
Import Libraries
First, we import the following python modules:
import seaborn as sns
import matplotlib.pyplot as plt
Load Data
We would like to use a seaborn sample dataset. Let's load the "tips" dataset into python.
tips_df = sns.load_dataset("tips")

tips_df.head()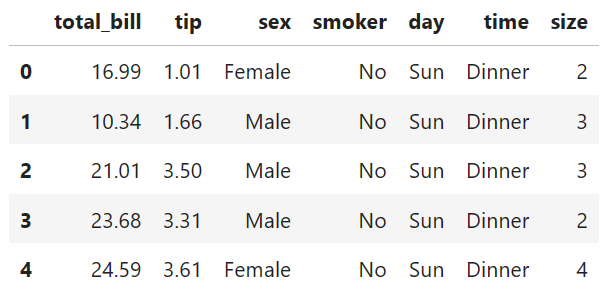
Stripplot
Stripplots are a special form of scatter plots and can be used to display the distribution of a numeric variable by a specific category.
By default, the points are randomly distributed along the categorical axis. This makes the points overlap less and clusters of data points become more visible.
Example 1: Plot one Variable
In our first example we want to visualize the given tips. In order to do this, we set the x parameter to "tip".
sns.stripplot(data=tips_df, x="tip")

plt.show()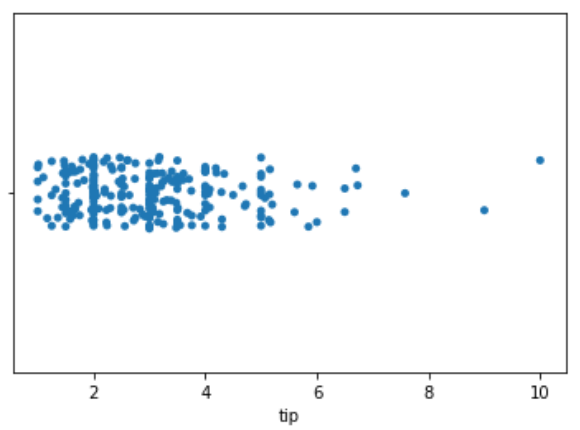
Example 2: Plot two Variables
Now, let's display the distribution of the tips for each day. In addition to the x parameter, we use the y parameter and set it to "day".
sns.stripplot(data=tips_df, x="tip", y="day")

plt.show()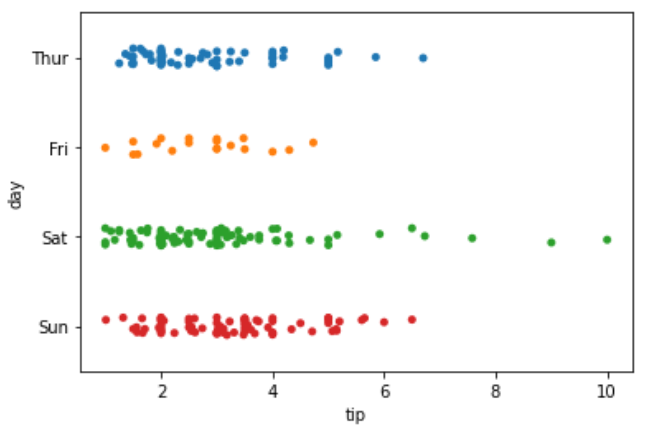
Example 3: Stripplot with Grouping
Now, let's highlight which tips were given at lunch and dinner. In order to do this, we use the hue parameter and set it to "time".
sns.stripplot(data=tips_df, x="tip", y="day", hue="time")

plt.show()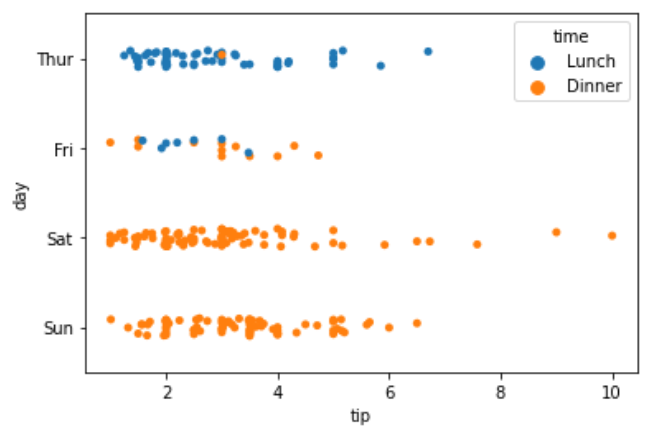
Example 4: Split Strips
Now, let's split the distribution for lunch and dinner into separate strips. In order to do this, we use the dodge parameter and set it to True.
sns.stripplot(data=tips_df, x="tip", y="day", hue ="time",
              dodge=True)

plt.show()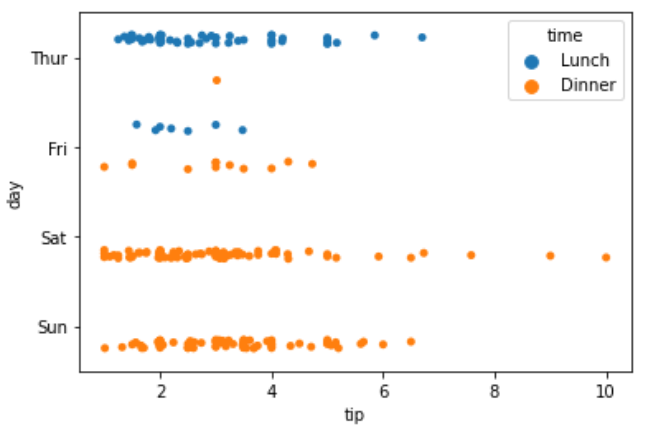
Example 5: Change Style
Now, let's modify the styling of the plot. We use stars as markers and choose a different color palette.
sns.stripplot(data=tips_df, x="tip", y="day", hue ="time",
              dodge=True, marker="*", size=22, alpha=0.3,
              palette= "mako")

plt.show()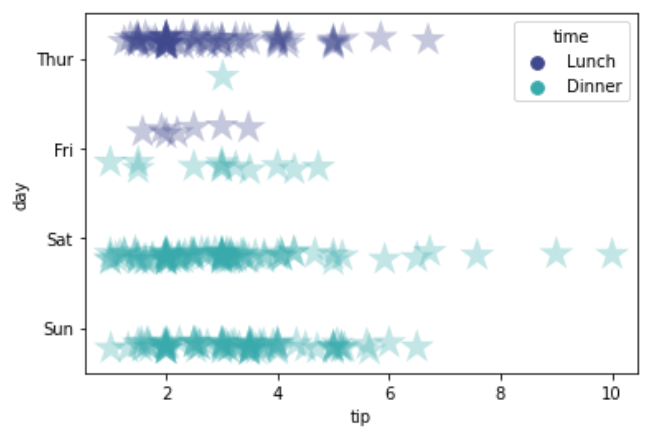
Conclusion
Congratulations! Now you are one step closer to become an AI Expert. You have seen that it is very easy to create a Stripplot. We can simply use the stripplot() function of Seaborn. Try it yourself!
Also check out our Instagram page. We appreciate your like or comment. Feel free to share this post with your friends.