


Introduction
Power BI offers with the Power Query Editor a powerful tool for cleaning and transforming data. One important part of data preparation is filtering your data. Filtering enables you to sort out irrelevant data and to reduce your amount of data. In this tutorial, we show you how to filter data with Power Query.
Data
The data for this tutorial comes from an Excel file. In the following tutorial, we have shown how to import Excel into Power BI.
 Data Analyst
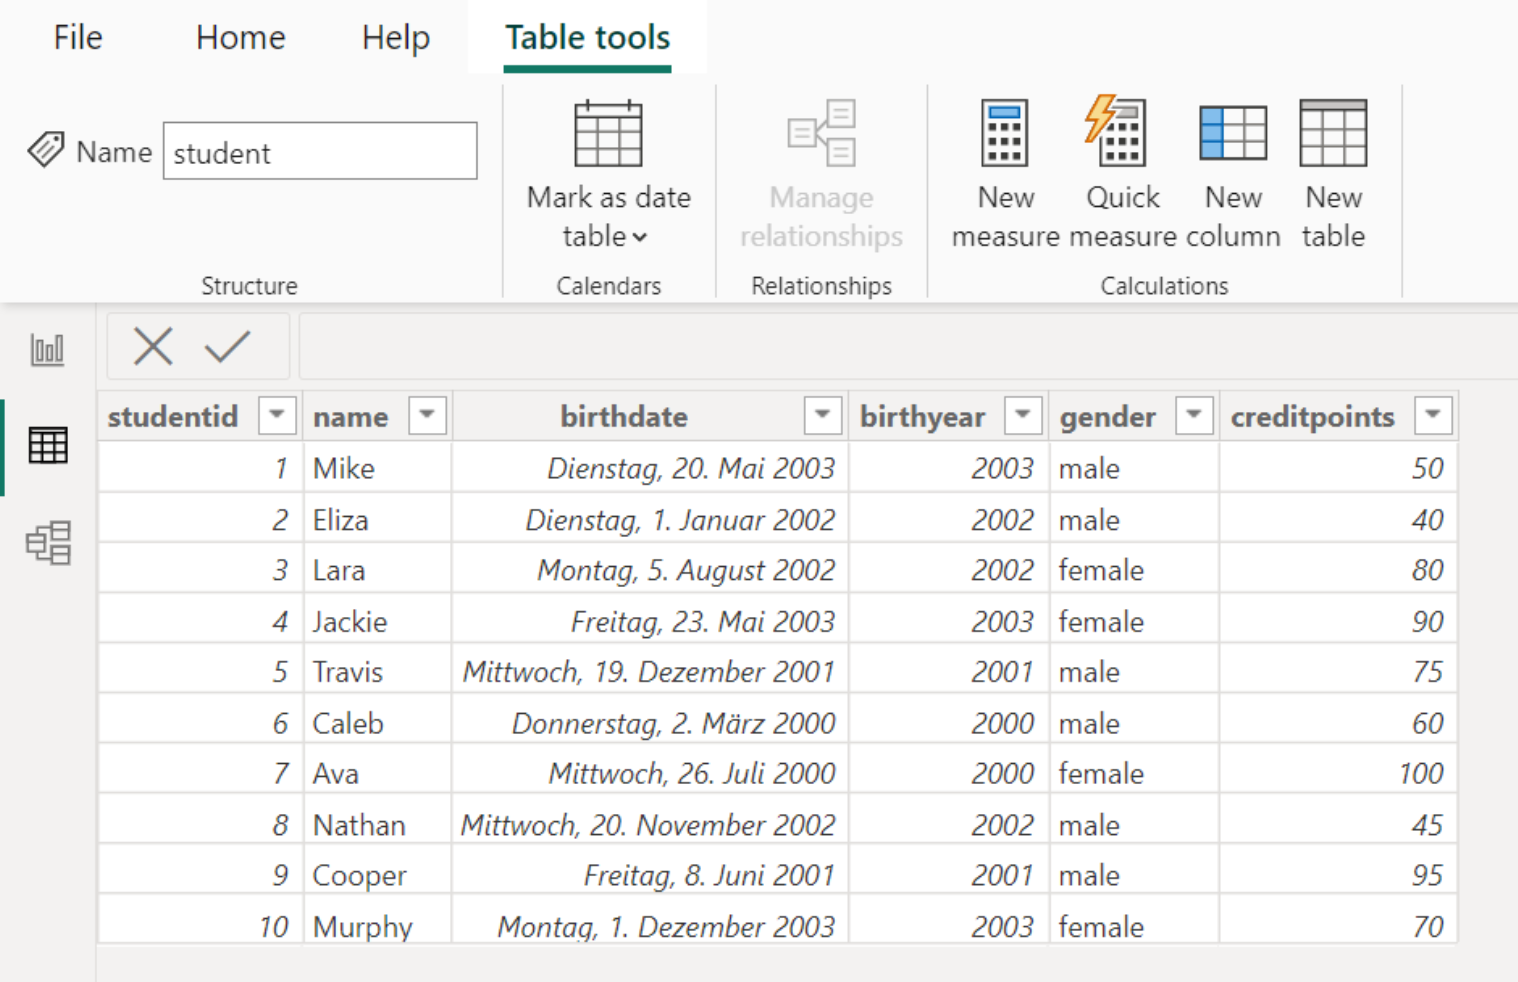
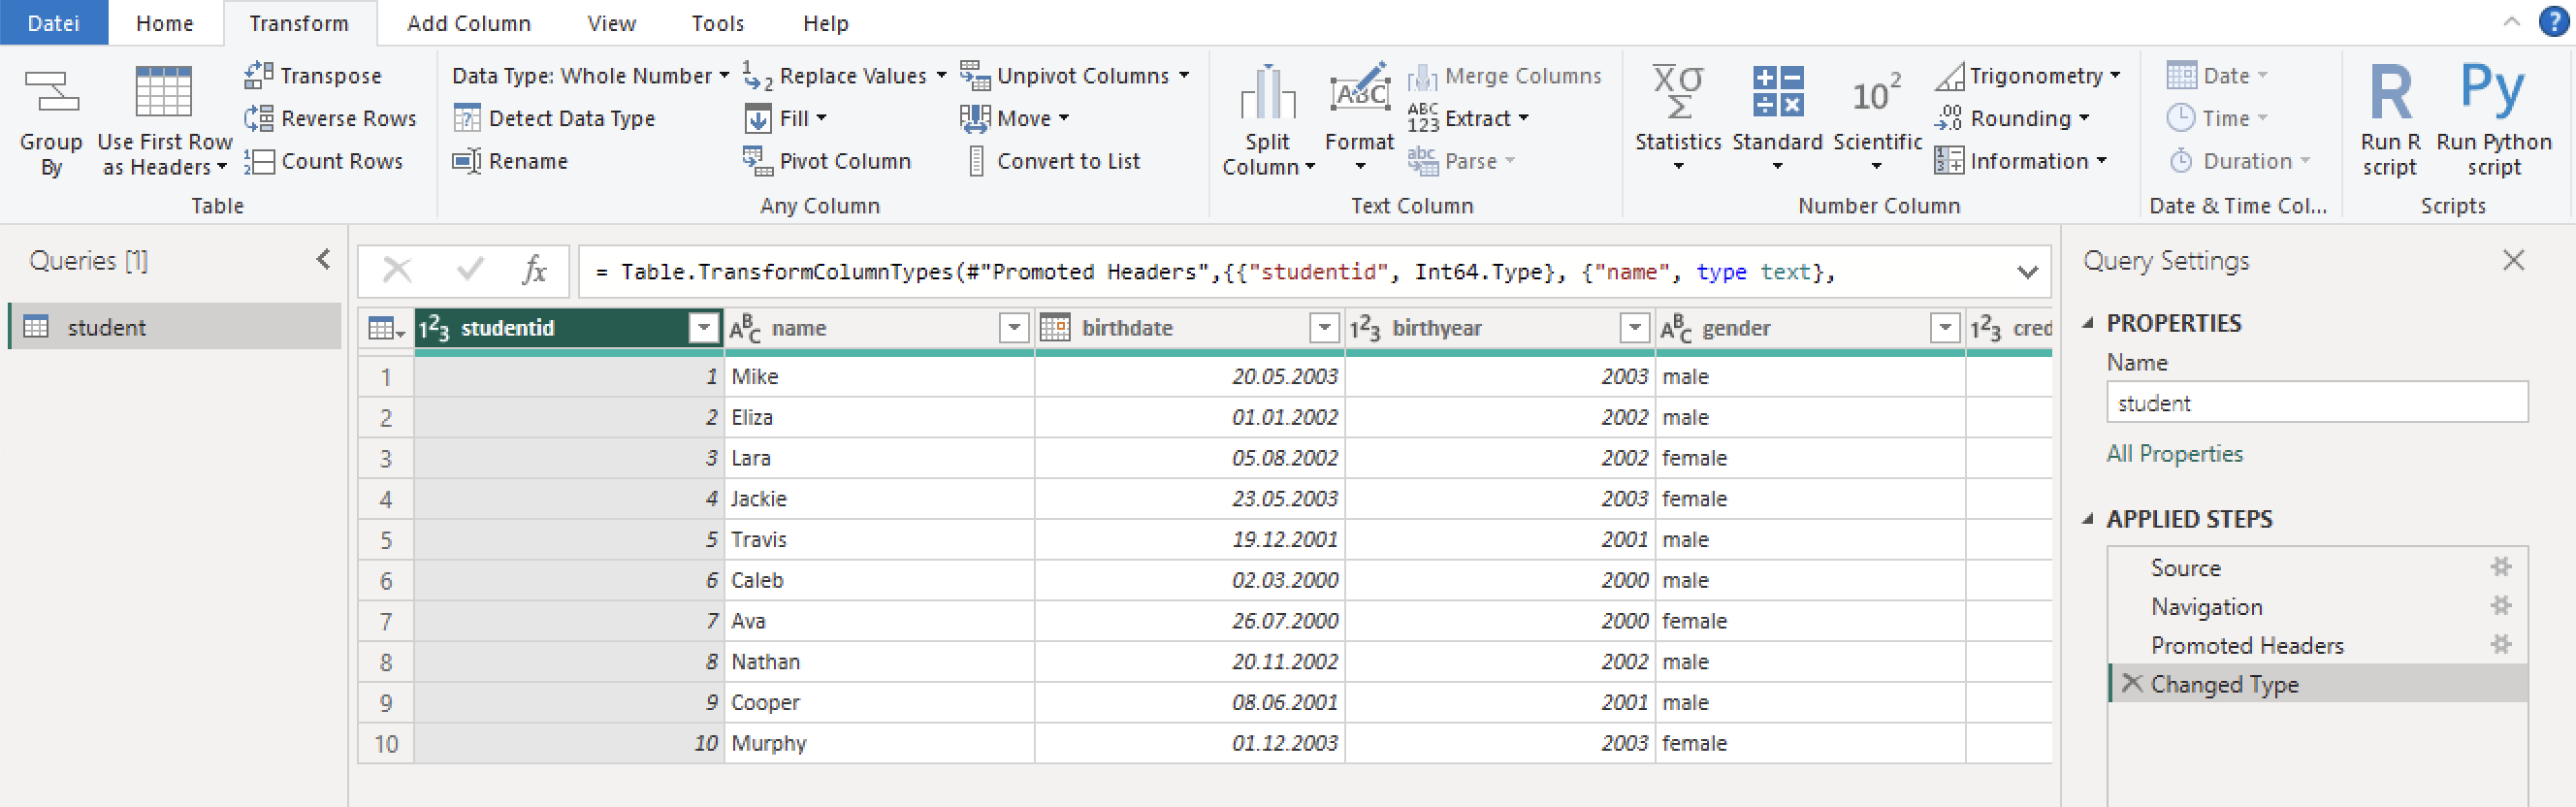
We have loaded the data into Power BI but we haven't executed any transformations on the data. The data looks as follows:
Now, let's explore how to execute some filter operations with Power Query.
Open Power Query Editor
First, we open the Power Query Editor by clicking on "Transform Data".
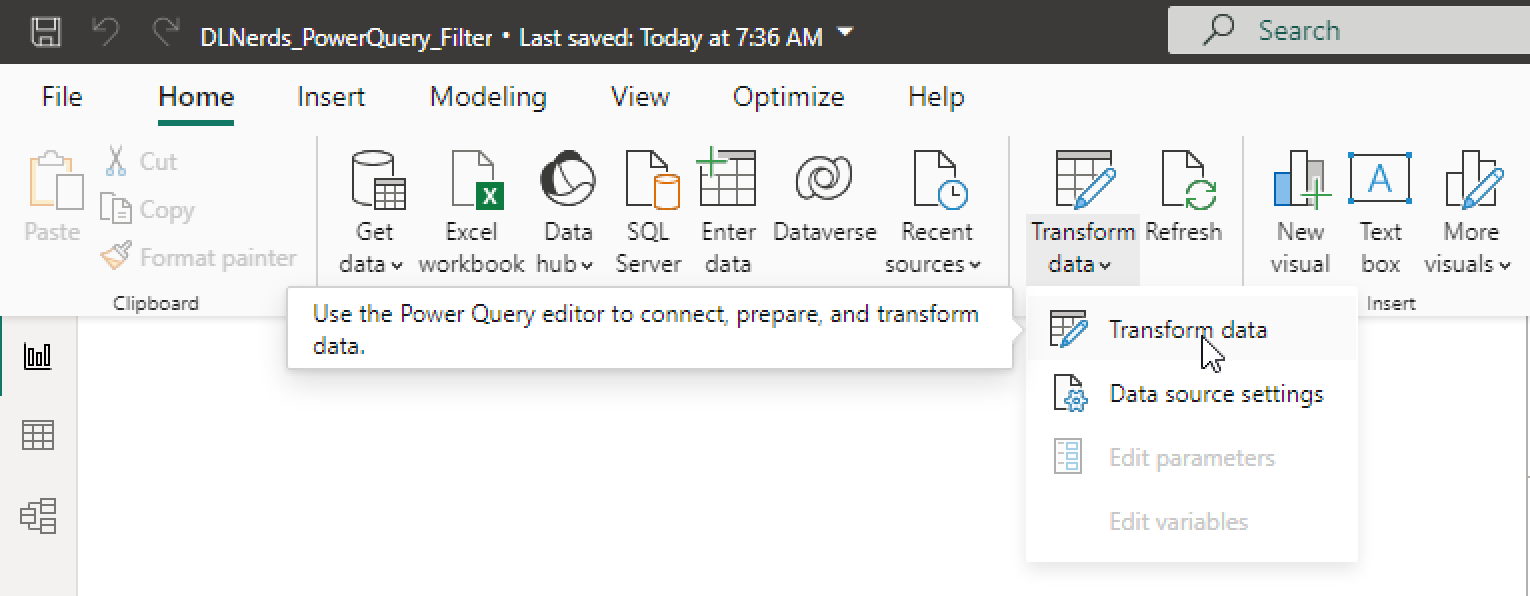
This takes us to the Power Query Editor interface.
Basic Filter
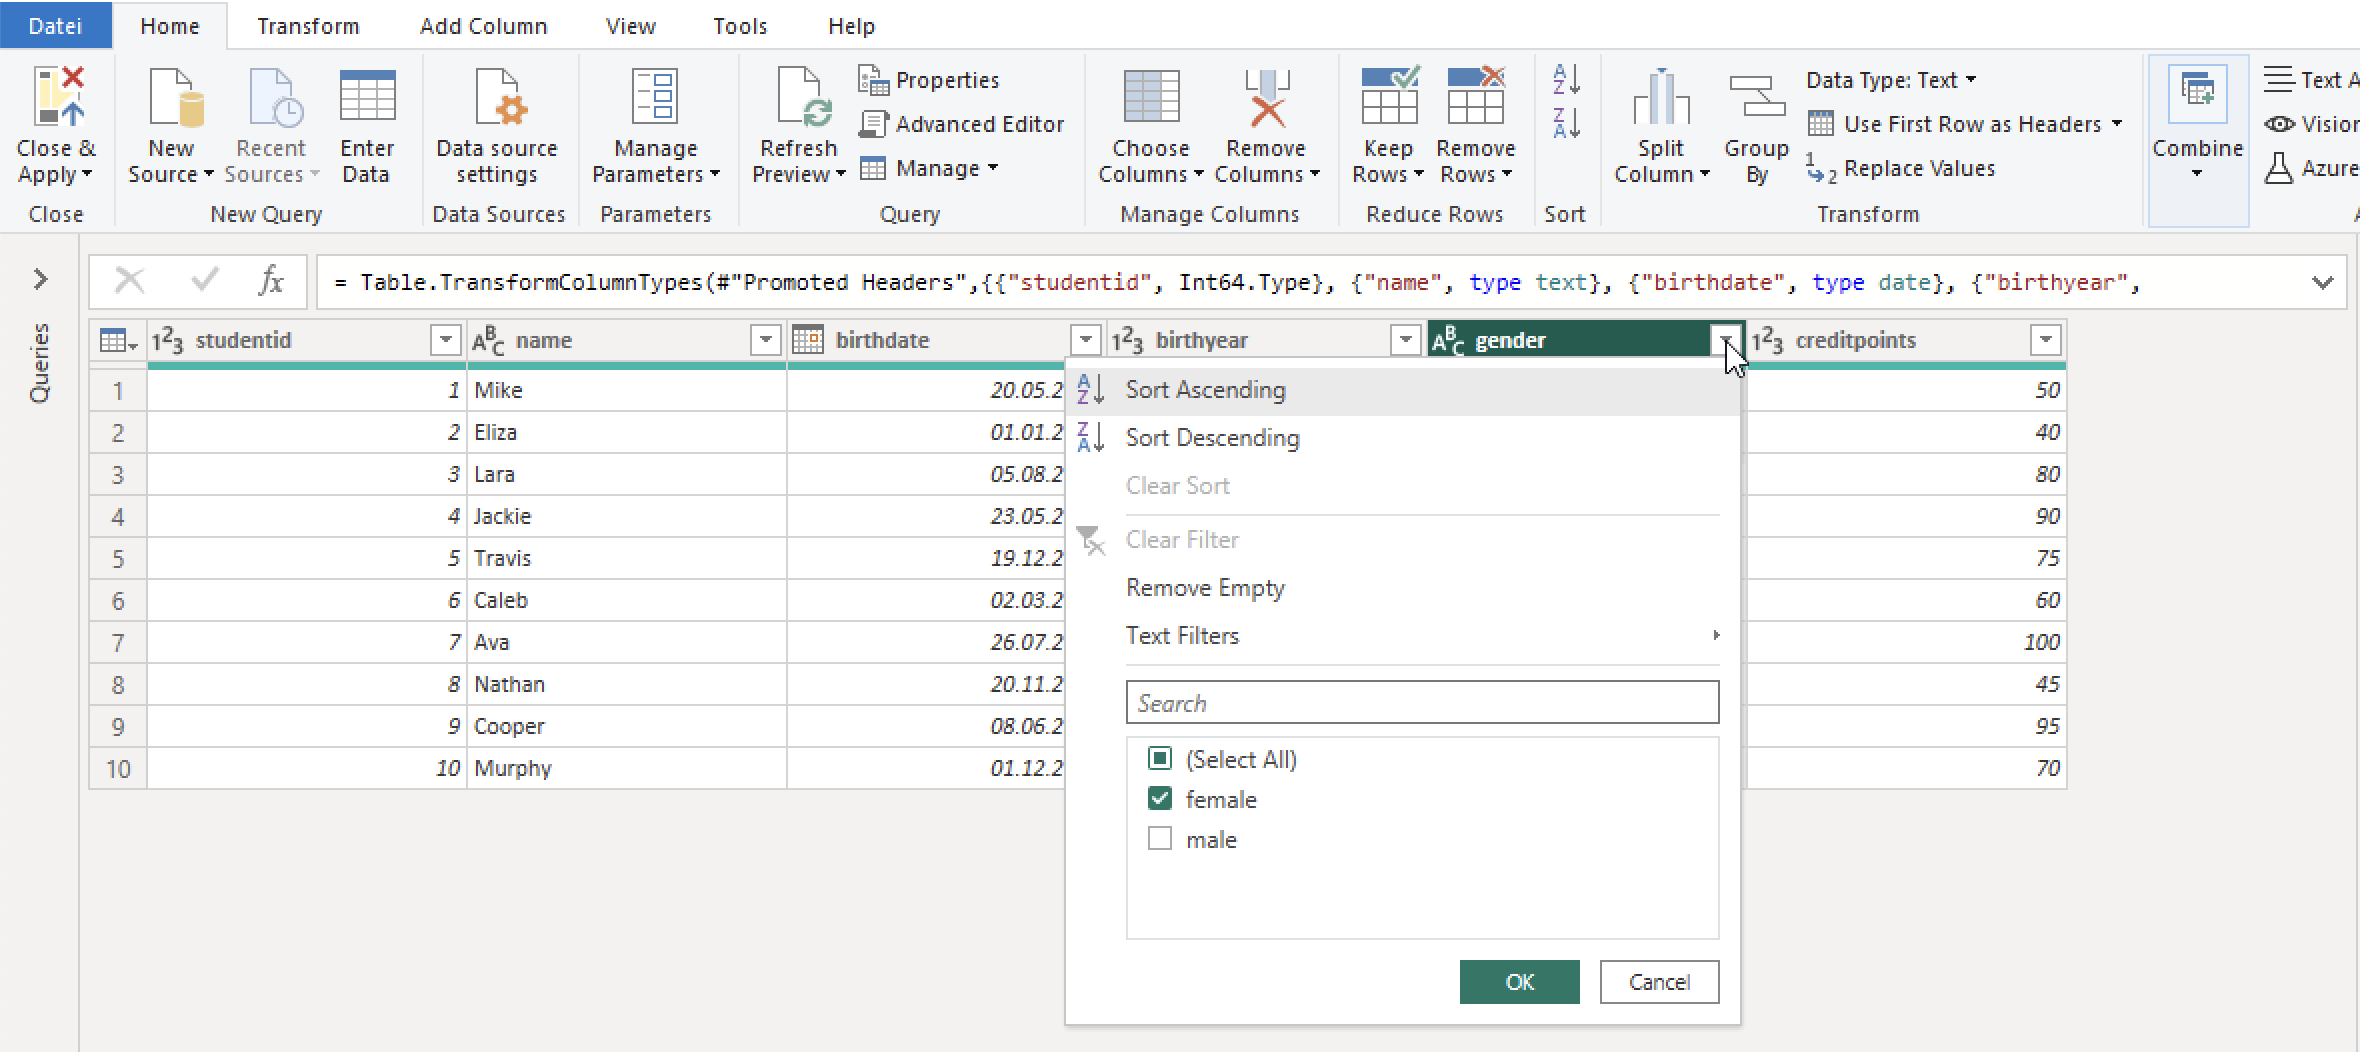
First, let's apply a simple filter for a specific column. In the following example, we only want to include female students. So, we need to filter the column "gender" by "female". To do this, we click on the down arrow of the column "gender" and select the value "female":
The filtered data looks as follows:
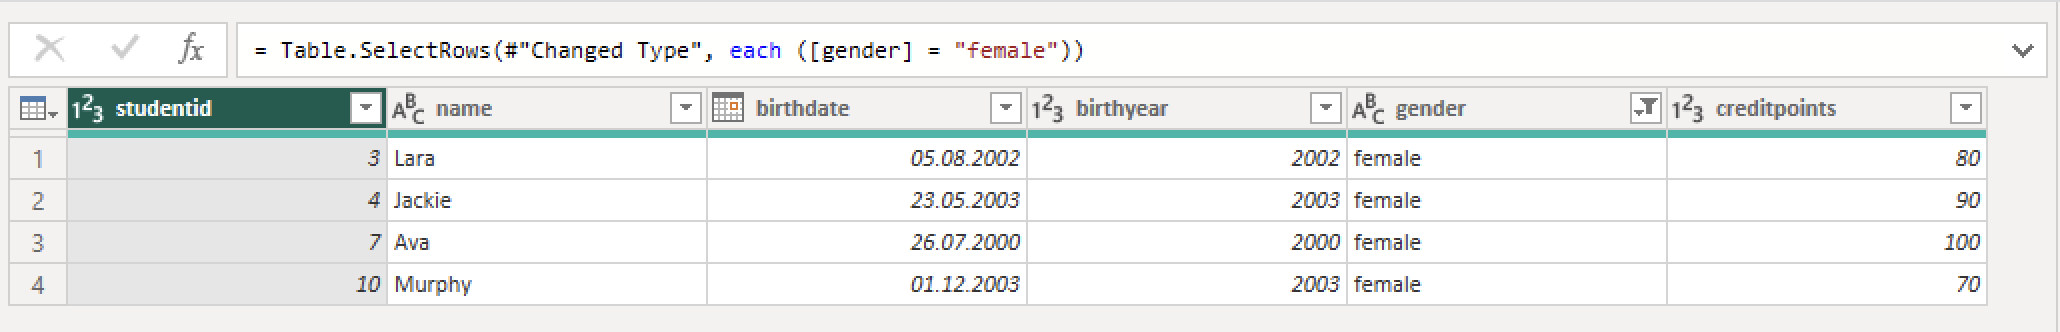
As you can see, the column "gender" ist filtered.
Multi-Column Filter
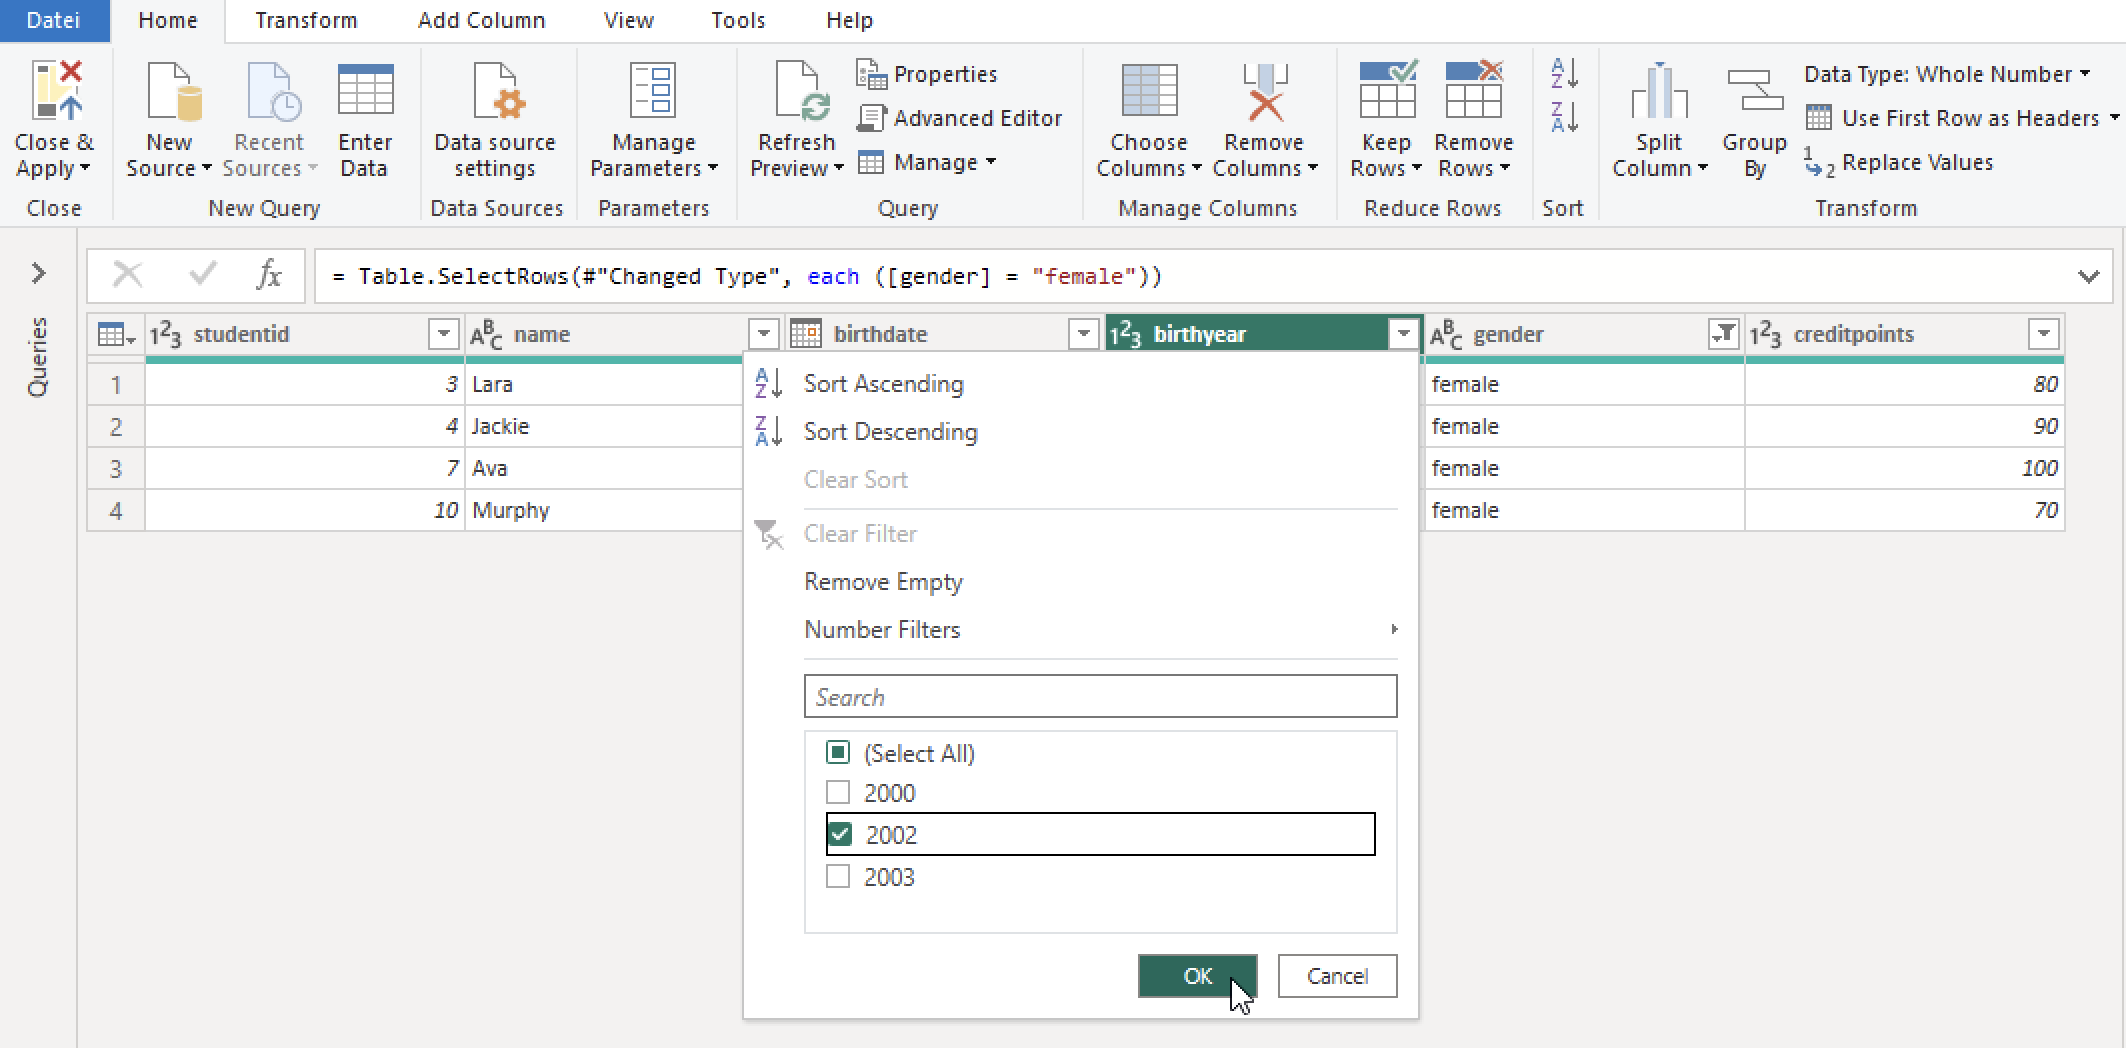
It is also possible to apply filters to several columns. In the following example, we only want to include female students born in 2002. So, we need to filter the column "gender" by "female" and the column "birthyear" by 2002. In the first step, we have already applied the filter for female students. Next, we also apply the filter for the birth year. To do this, we click on the down arrow of the column "birthyear" and select the value 2002:
The filtered data looks as follows:
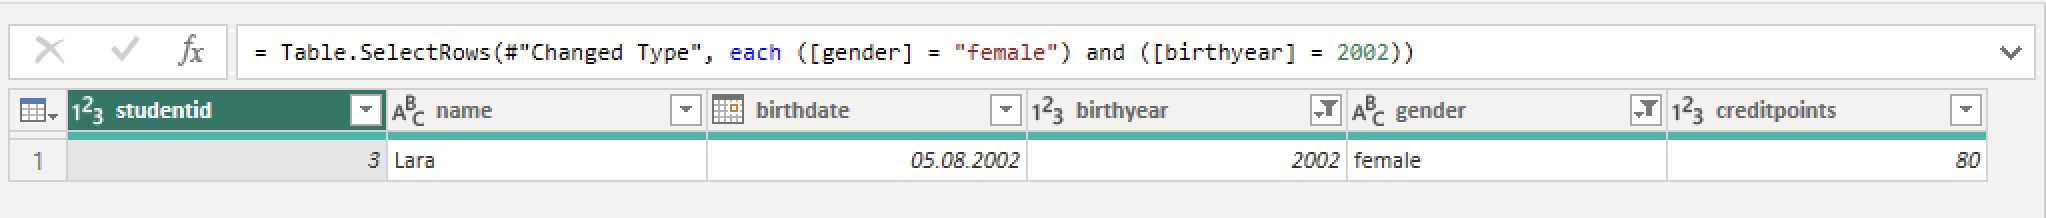
As you can see, both columns "gender" and "birtyear" are filtered.
Filter Top N Rows
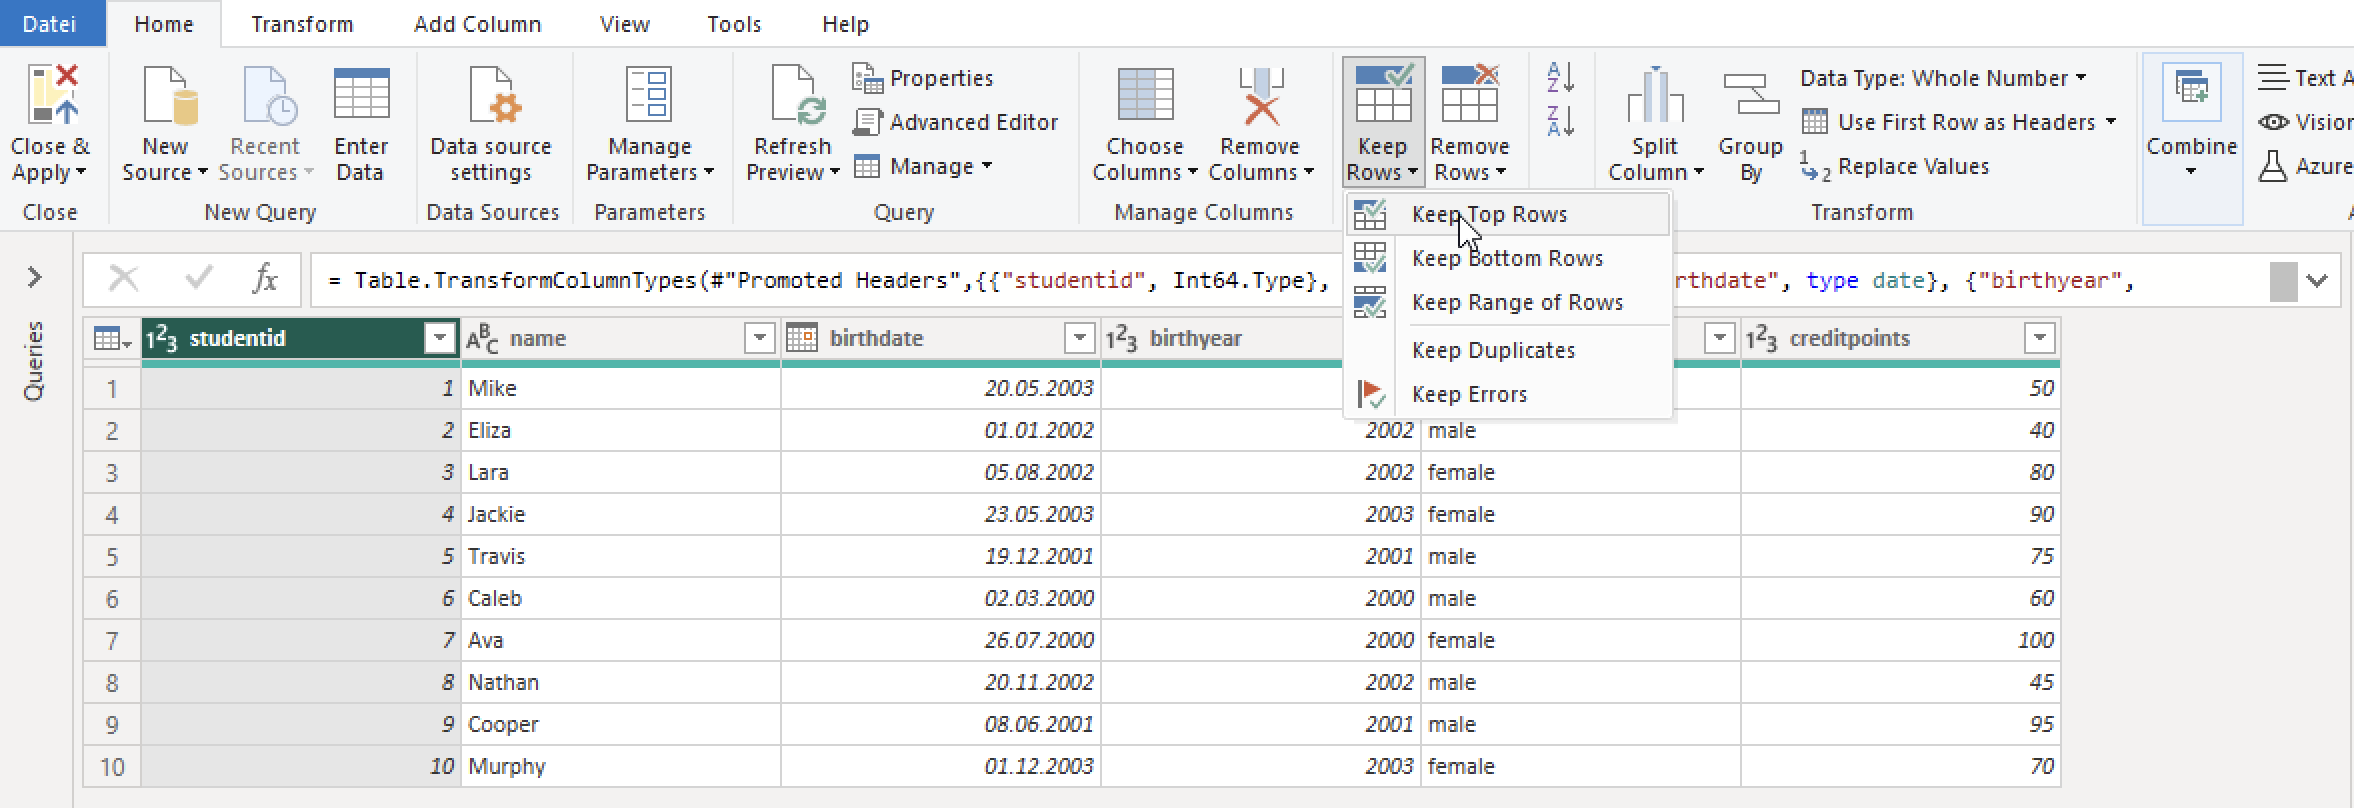
If you don't want to filter by a specific column but just want to reduce the amount of data, you can use the Top N filter. This allows you to select a certain number of rows.
In the following example, we only want to include the top three rows. To do this, we click on "Keep Top Rows":
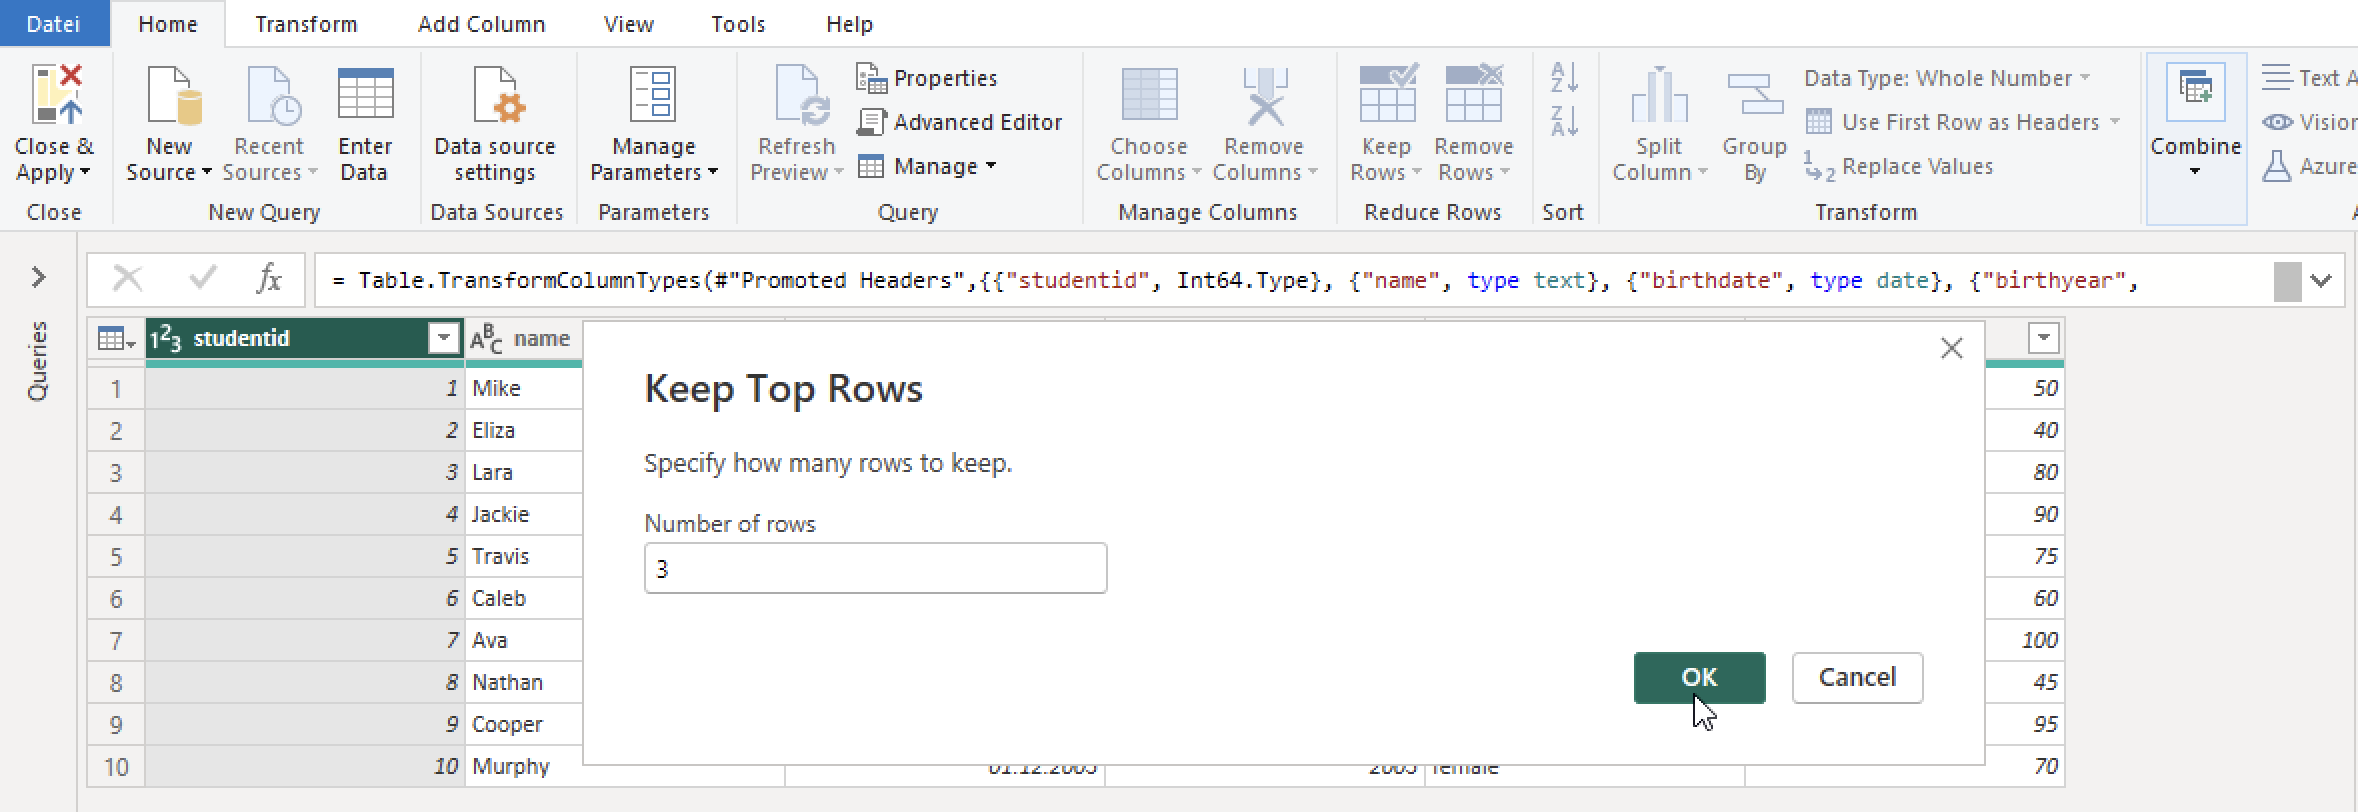
Next, a new window opens in which we enter the desired number of rows. In our case, we enter 3 and click "OK":
The filtered data looks as follows:
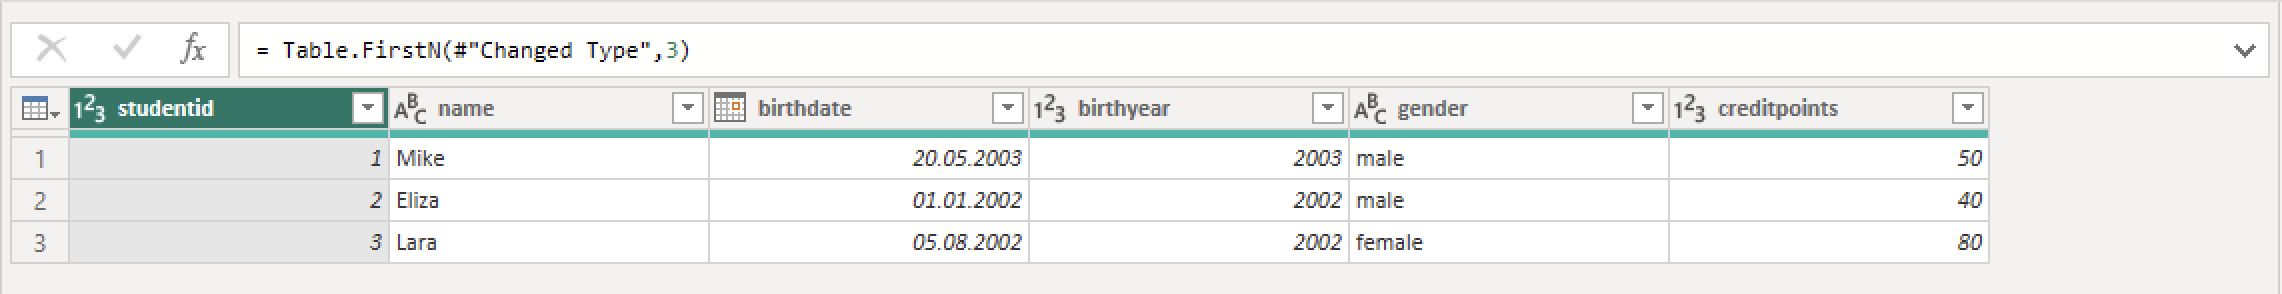
As you can see, only the first three rows are selected.
Conclusion
Congratulations! Now you are one step closer to become an AI Expert. You have learned how to filter Data with Power Query. You have seen that you can filter by one or more columns. If you only want to reduce the amount of data, you can use the Top N filter. Try it yourself!
Also check out our Instagram page. We appreciate your like or comment. Feel free to share this post with your friends.